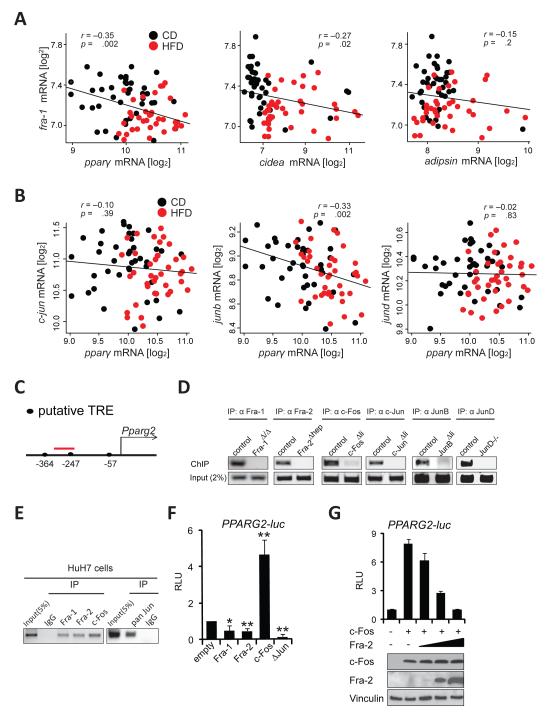
Figure 5. Several AP-1 proteins regulate the PPARγ pathway.
Correlation plots for fra-1 with pparγ,cidea and adipsin (A) and for Jun members with pparγ(B) in CD and HFD (5months; 60 % kCal/fat) in the BXD inbred family. Each data point represents the average expression from 5 pooled mice. Pearson’s r was used to analyze correlations and p-values are indicated. (C) Proximal murine Pparg2 promoter: Position of the putative AP-1 binding TPA-responsive element (TRE) is indicated relative to the transcription start. The ChIP-PCR amplicon is depicted in red. (D)ChIP assays using hepatic chromatin from AP-1-deficient mice. Endpoint PCR products representative of 3 independent experiments are shown. (E) ChIP assays in Huh7 cells; primers amplifying a region homologous to (C) were used. Data are representative of 3 independent experiments. (F,G) Human PPARG2 reporter assays in HuH7 cells. Data are mean±s.e.m of 4 independent experiments in (F). Technical replicates of one representative experiment (n=2) is shown and ectopic c-Fos and Fra-2 expression is confirmed by immunoblot in (G). RLU: relative luminescence units. ΔJun: truncated c-Jun. Control (empty vector) is set to 1. Bar graphs are presented as mean±SEM. See also Figure S3.

