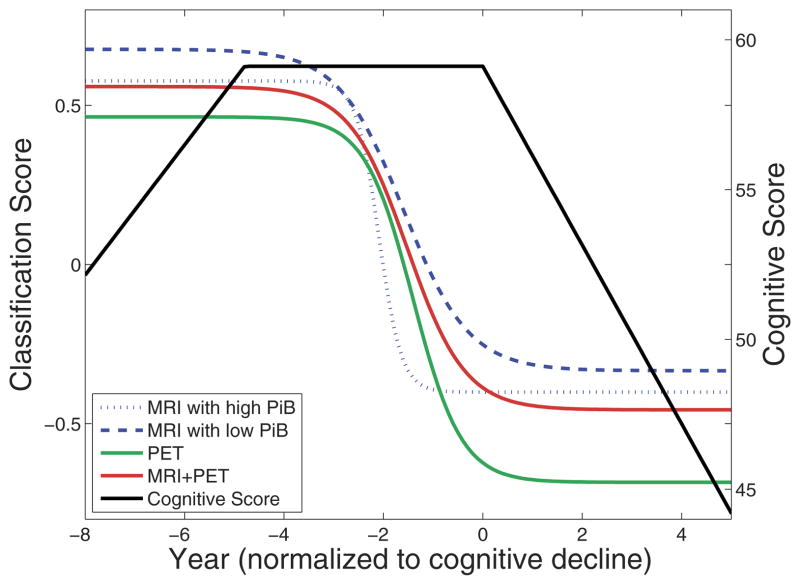
Fig. 2.
MRI, [15O] PET-CBF, [11C] PiB PET, and high-dimensional pattern classification allow for the detection of cognitive decline. Median fits to longitudinal data, for cognitive (California Verbal Learning Test [CVLT] immediate free recall) scores and imaging (MRI and [15O] PET-CBF) classification scores. Classification scores are negative SPARE-CD values, representing similarity of brain patterns to cognitively stable (CS) or cognitively declining (CD) subjects (higher and lower values, respectively). Years have been normalized to the point of CVLT decline. It is apparent from this graph that MRI and [15O] PET-CBF SPARE-CD scores, on average, show cognitive decline more than 2 years before CVLT scores. In addition, because MRI SPARE-CD scores and [11C] PiB PET mean cortical distribution volume ratio (DVR) scores are significantly correlated, the difference between MRI with high (top tertile) and low (bottom tertile) [11C] PiB PET is shown here. For interpretation of the references to color in this figure legend, the reader is referred to the Web version of this article.

