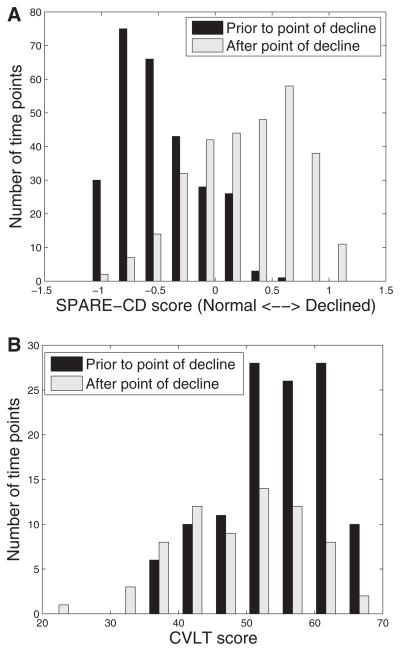
Fig. 4.
Separability of SPARE-CD and CVLT scores with respect to estimated point of decline. All SPARE-CD scores (Fig. A, using MRI and [15O] PET-CBF) and CVLT scores (Fig. B) at time points at least 1 year before the estimated point of decline for each subject are included in the black histogram, whereas those at least 1 year after estimated point of decline are included in the gray histogram. Subjects with points of decline estimated at first or last available years have been removed.

