
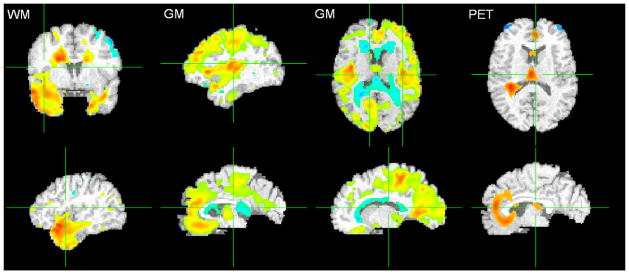
Fig. 7.
T-tests comparing cognitively stable (CS) and cognitively declining (CD) subject groups for MRI RAVENS maps and [15O] PET-CBF images. More red implies higher statistical significance and presence of tissue (or activity, in the case of PET-CBF) in CS subjects, whereas more blue implies higher statistical significance and presence of tissue (or activity) in CD subjects. Overlaid on the template brain. Left: WM (Q < 0.05, t-statistic −6.3 [blue] to 7.0 [red]); Middle: GM (Q < 0.05, t-statistic −6.2 [blue] to 8.3 [red]); Right: [15O] PET-CBF (p < 0.005, −4.8 [blue] to 4.8 [red]). Periventricular abnormal WM typically appears gray and is segmented as GM; hence the blue areas near the ventricles in the GM map (top row) represent more small-vessel disease in CD subjects. Images are in radiological convention (Left = Right). For interpretation of the references to color in this figure legend, the reader is referred to the Web version of this article.