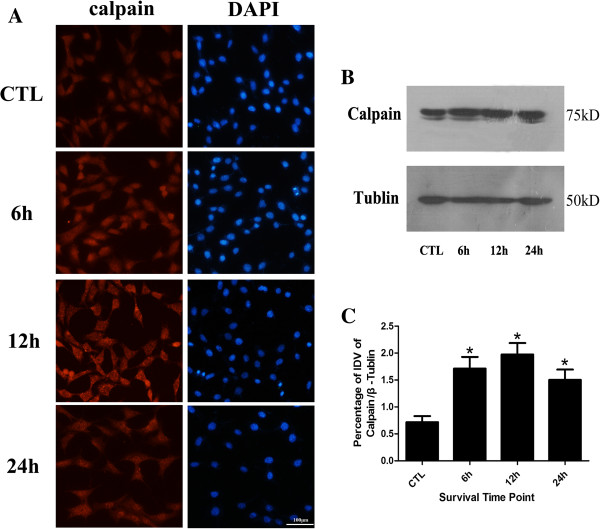
Figure 5.
Calpain protein expression level detection. Panel A: Immunofluorescence staining of calpain; Panel B: Western blot of calpain after cell injury; Panel C: The statistical analysis of calpain western blot bands; *: 6 hr, 12 hr and 24 hr group vs CTL group: p < 0.05, scale bar = 100 μm in panel A.

