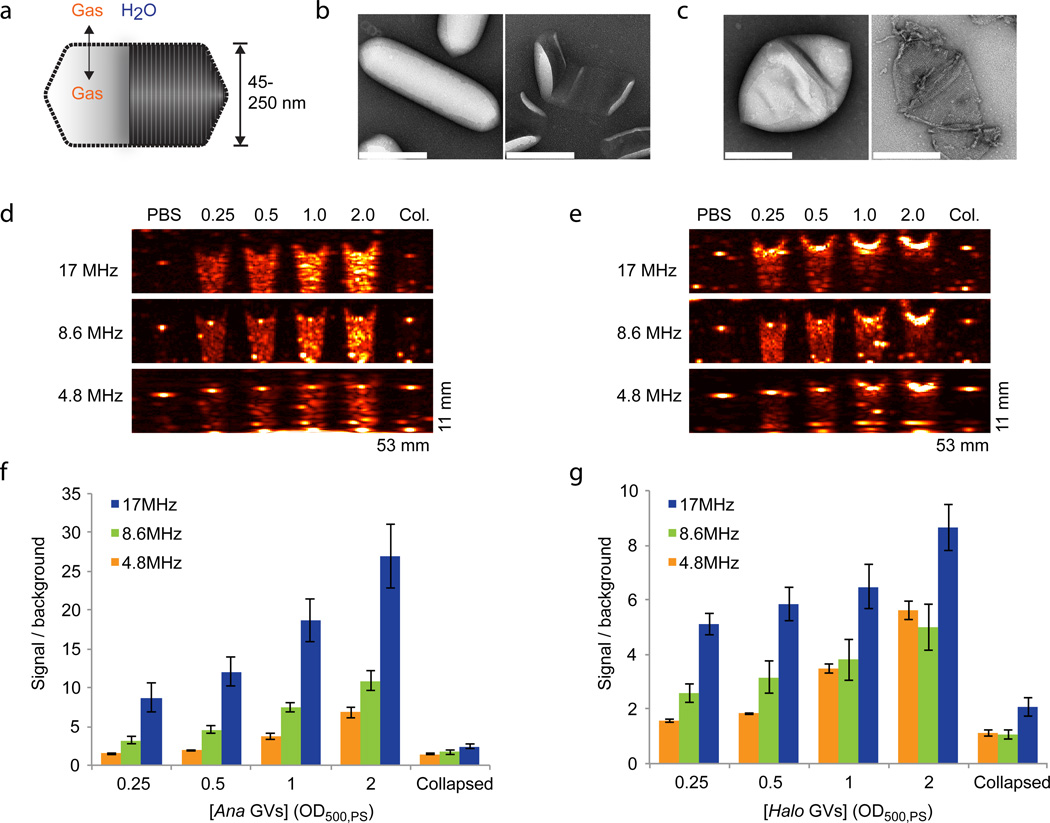
Figure 1. Gas vesicles produce ultrasound contrast.
a, Diagram of a gas vesicle: a hollow gas nanocompartment (solid shading) surrounded by a gas-permeable protein shell (ribbed shading). b, TEM images of intact (left) and hydrostatically collapsed (right) Ana GVs. c, TEM images of intact (left) and collapsed (right) Halo GVs. All scale bars 200 nm. d, Ultrasound images of a gel phantom containing PBS buffer, Ana GVs at optical densities ranging from OD 0.25 to 2 (concentrations of 150 pM to 1.2 nM) or collapsed Ana GVs (OD 2.0). Images were acquired at multiple frequencies, as indicated. e, Ultrasound images of a gel phantom containing PBS buffer, Halo GVs at optical densities ranging from OD 0.25 to 2 (concentrations of 5 to 40 pM) or collapsed Halo GVs (OD 2.0). Conversion between OD, molar concentration and gas volume fraction is described in the Methods. f, Total backscattered signal relative to PBS at each frequency and Ana GV concentration (N=4 per sample). g, Total backscattered signal relative to PBS at each frequency and Halo GV concentration (N=4 per sample). Detailed image acquisition and analysis parameters are provided in Supplementary Table S1; colour maps for ultrasound images in Supplementary Fig. S9. The size of each field of view is indicated in the lower right corner of the image. All error bars represent ± SEM.

