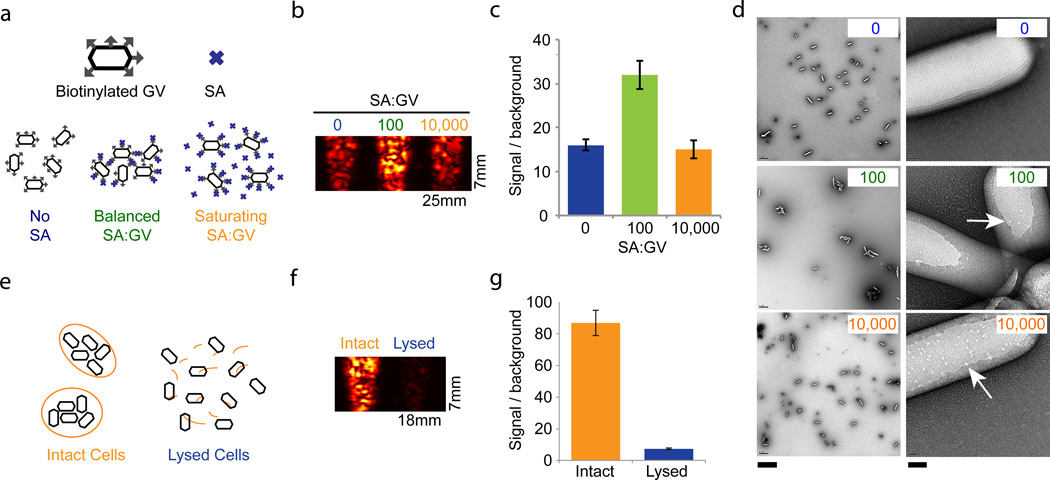
Figure 3. Gas vesicles act as biomolecular sensors and report cellular integrity.
a, Illustration of predicted aggregation interactions between surface-biotinylated GVs (hexagons with gray arrows) and streptavidin (SA) at different SA:GV ratios. b, 17 MHz image of OD 1.0 biotinylated Ana GVs mixed with the indicated ratio of SA. c, Integrated signal intensity relative to phantom background corresponding to the SA:GV conditions in (b) (N=4 per condition). d, TEM images of Ana GVs incubated with SA at the indicated molar ratios on the top right hand corner of each panel. At the higher magnification (right), arrows indicate apparent SA molecules on the GV surface. Scale bars 2 µm (left) and 40 nm (right). e, Illustration of GVs (black hexagons) confined inside intact cells (orange) or released following lysis. f, Ultrasound image (17 MHz pulses) of Ana cells treated with water (intact) or with 25% sucrose (lysed). g, Integrated signal intensity relative to phantom background for intact and lysed cells (N=4 per condition). Detailed image acquisition and analysis parameters are provided in Supplementary Table S1; colour bars for ultrasound images in Supplementary Fig. S9. The size of each field of view is indicated in the lower right corner of the image. All error bars represent ± SEM.

