
Figure 6.
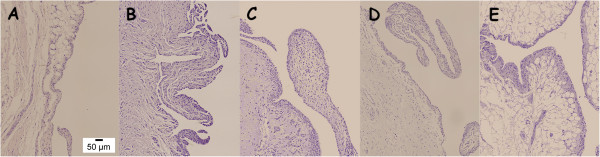
Representative histology images of synovial membrane sections. Magnification 20x. A: CTRL; B: OA; C: OA + GS; D: OA + RS; E: OA + GS&RS. In the risedronate treated groups (D and E) the characteristics are more similar to control (A), in glucosamine treated (C) were present infiltrations of inflammatory cells as in OA (B).