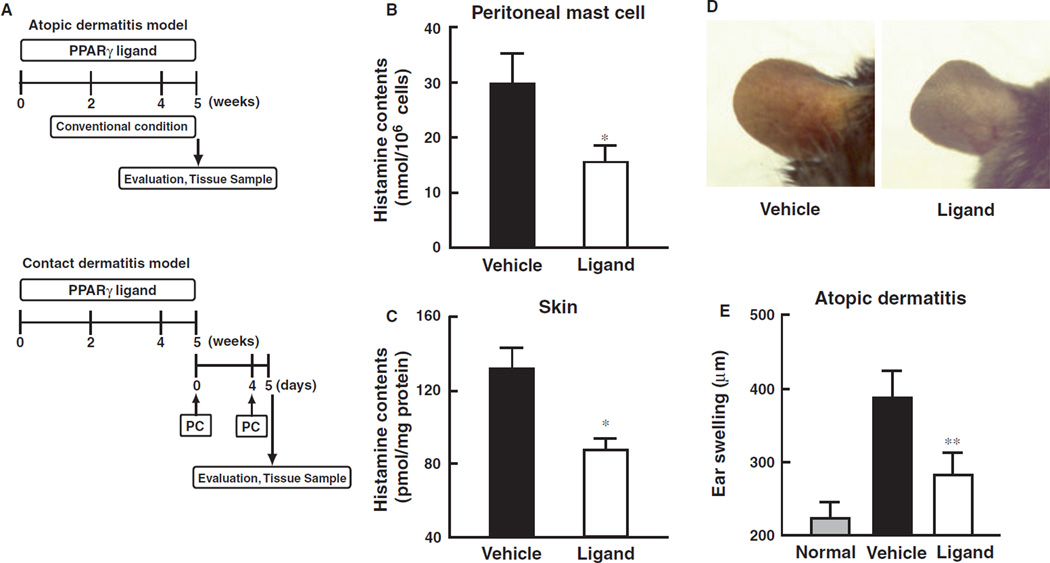
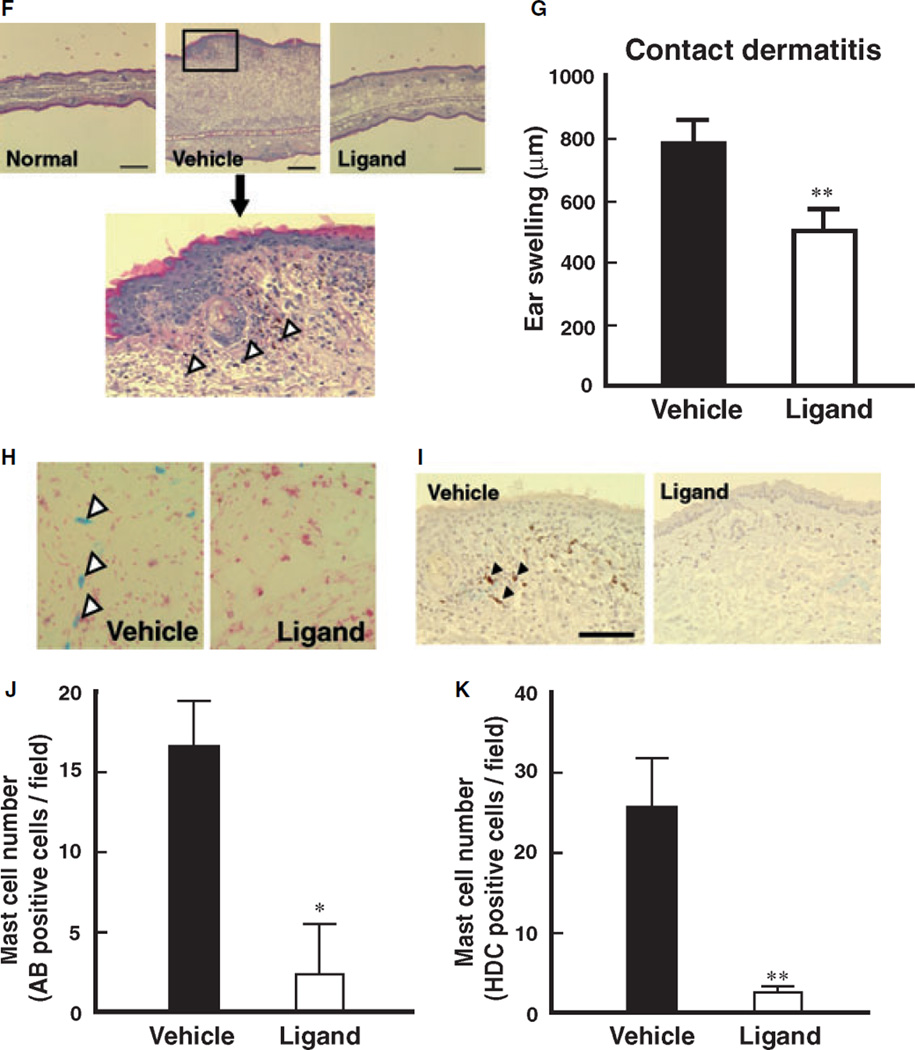
Figure 1.
Attenuation of PPARγ ligand on atopic and contact dermatitis models in mice. (A) Schematic protocol of murine-atopic (upper panel) and contact dermatitis (lower panel) models. Dietary administration of PPARγ ligand, pioglitazone (approximately 25.60–28.08 mg/kg), was performed according to our previous study. In the murine-atopic dermatitis model, NC/Nga mice were housed under conventional conditions for 4 weeks. Spontaneous dermatitis similar to human atopic dermatitis was observed. In the murine-contact dermatitis model, NC/Nga mice were sensitized with picryl chloride (PC) on the ventral skin at day 0. On the day 4, the mice were challenged with picryl chloride (PC) on ear. Ear thickness was measured by a dial thickness gauge. (B and C) Histamine content of skin (B) and peritoneal mast cells (C) prepared from mice treated with PPARγ ligand (pioglitazone) or vehicle. Data represent mean ± SEM from five to seven independent animals. *P < 0.05 vs vehicle control. (D) Macroscopic observation atopic dermatitis of ear from vehicle-control or ligand. (E) Effect of PPARγ ligand, pioglitazone, on atopic dermatitis model. Ear thickness, as an index of edema, was expressed as ear swelling (µm). Normal group was before initiation of dermatitis. Data represent mean ± SEM from five to seven independent animals. **P < 0.01 vs vehicle control. (F) Typical microscopic pictures of ears from mice of normal, vehicle, and PPARγ ligand-treated group on antigen-induced contact dermatitis model. Hematoxylin-eosin stain was performed. Scale bar represents 200 µm. Lower panel represents large magnification of ear from vehicle group. Arrowheads represent infiltrated inflammatory cells. (G) Effect of PPARγ ligand, pioglitazone, on dermatitis model. Ear thickness, as an index of edema, was expressed as ear swelling (µm). Data represent mean ± SEM from five to seven independent animals. **P < 0.01 vs vehicle control. (H) Microscopic observations of the increase in mature mast cells in tissues from vehicle-control or PPARγ ligand treated mice on contact dermatitis model. Representative photomicrographs of mouse ear sections were stained with alcian blue-nuclear fast red from vehicle-control or PPARγ ligand treated mice. In this condition, mature mast cells are stained as a blue color indicated by arrowheads. (I) Immunohistochemical staining of HDC in ear tissues of mice from vehicle, and PPARγ ligand-treated groups on contact dermatitis model. HDC expressing cells are shown by a brown color (arrow heads). Scale bar represents 50 µm. (J) Alteration of alcian blue-positive cell number in ear tissues of mice from vehicle, and PPARγ ligand-treated groups on contact dermatitis model. Alcian blue-nuclear fast red positive cell number was counted and expressed as matured mast cell number per field. Each column represents mean ± SEM from five to seven independent animals. *P < 0.05 vs vehicle control. (K) Alteration of HDC positive-cell number in ear tissues of mice from vehicle, and PPARγ ligand-treated groups on contact dermatitis model. HDC positive cell number was counted and expressed as matured mast cell number per field. Each column represents mean ± SEM from seven to seven independent animals. **P < 0.01 vs vehicle control.


