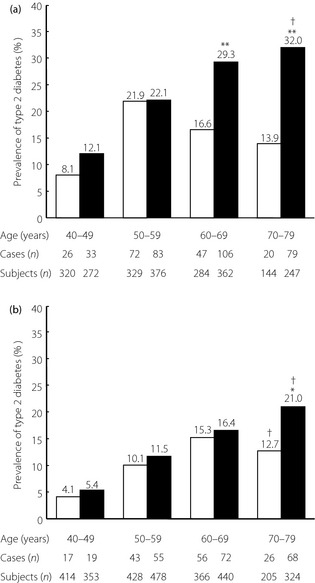
Figure 2.

Secular trends in the prevalence of type 2 diabetes according to age groups in 1988 and 2002 by sex. (a) Men. (b) Women. *P < 0.05, **P < 0.001 vs 1988, †P for trend <0.001. □, 1988; ■, 2002.

Secular trends in the prevalence of type 2 diabetes according to age groups in 1988 and 2002 by sex. (a) Men. (b) Women. *P < 0.05, **P < 0.001 vs 1988, †P for trend <0.001. □, 1988; ■, 2002.