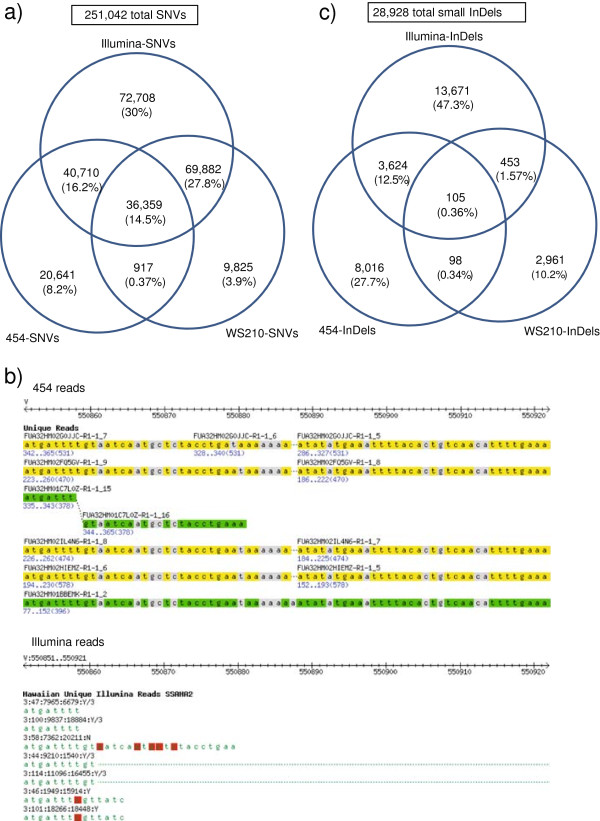
Figure 1.
Agreement of SNVs and InDels found with different methodologies. a) Venn diagram of SNVs found with different methodologies. b) Example of a highly variable region, alignment of 454 reads (top) and Illumina reads (bottom). The region corresponds to V:550851..550921 in the left arm of chromosome V. Reads in green colour indicate those aligned on the positive strand, whereas reads in yellow indicate those aligned on the negative strand. Base pair differences between Hawaiian reads and the reference genome are depicted in grey for the 454 reads and in red for the Illumina reads. c) Venn diagram of small InDels found with different methodologies.

