
Figure 3.
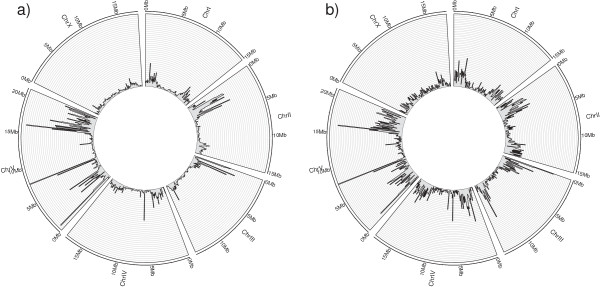
CIRCOS representation of a) SNVs genomic distribution, b) small InDels genomic distribution. The figures were generated using the histogram option, with a bin size of 100,000 bps.
Official websites use .gov
A
.gov website belongs to an official
government organization in the United States.
Secure .gov websites use HTTPS
A lock (
) or https:// means you've safely
connected to the .gov website. Share sensitive
information only on official, secure websites.
CIRCOS representation of a) SNVs genomic distribution, b) small InDels genomic distribution. The figures were generated using the histogram option, with a bin size of 100,000 bps.