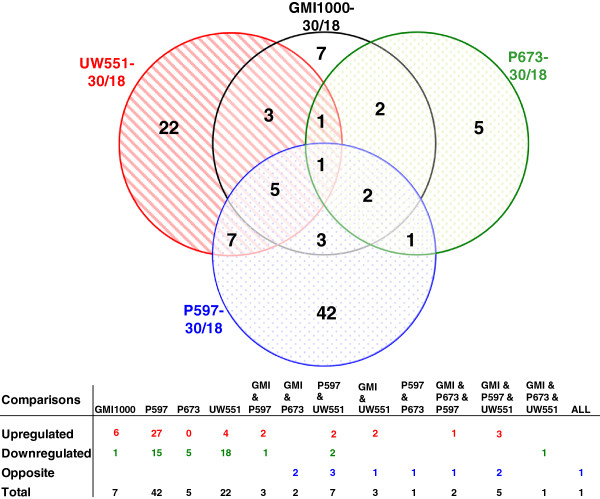
Figure 1.
Venn diagram showing the number and relationship of proteins differentially expressed for the temperature comparisons. Circles represent the set of proteins differentially expressed for the comparison in the label. The number of proteins differentially expressed is indicated in each set or subset. Tables underneath the comparisons indicate the regulation of the differentially expressed proteins.

