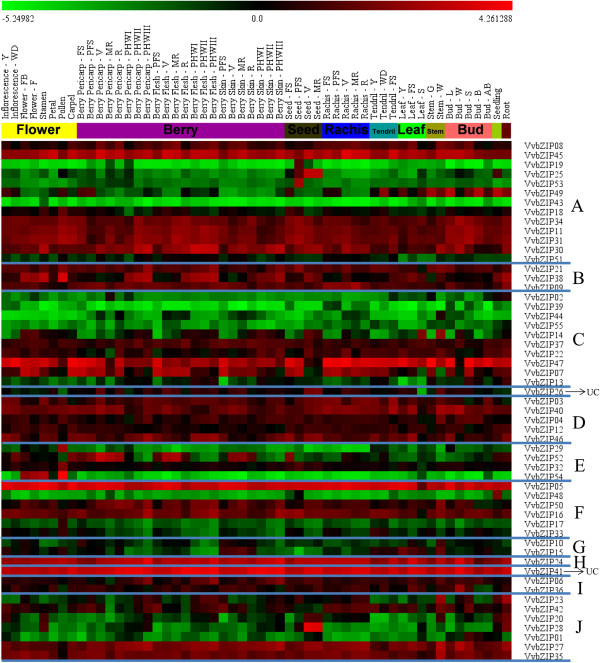
Figure 5.
Expression profiles of VvbZIP genes in 54 samples including green and woody tissues and organs at different developmental stages and some specialized tissues. Fluorescence intensities values were log2-based. Genes were listed according to those in the phylogenetic tree and samples names are based on the gene expression atlas of grapevine [50].

