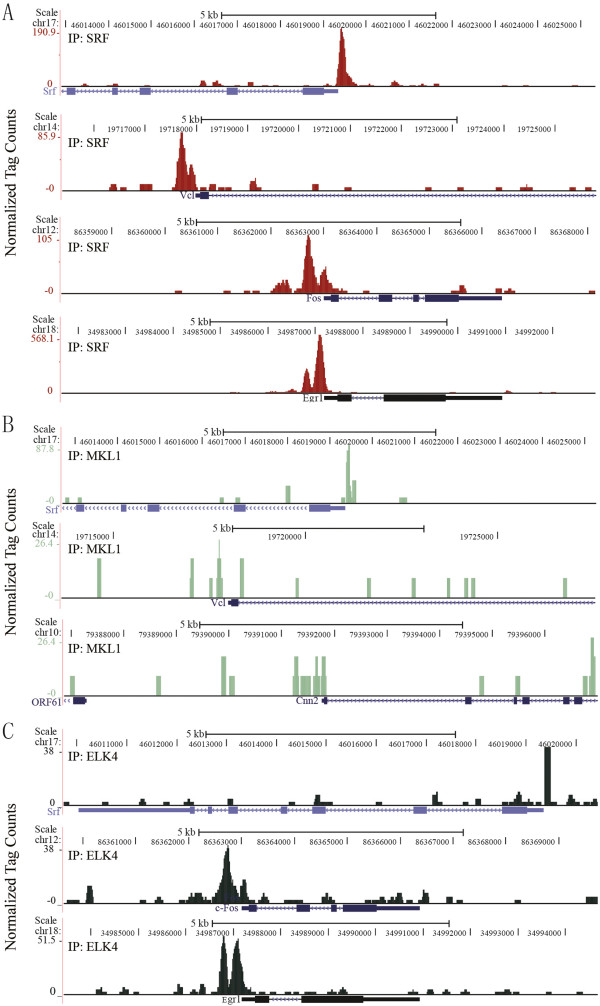
Figure 5.
UCSC Genome Browser images for SRF, MKL1 and ELK4 ChIP-seq peaks on representative target genes. (A) UCSC Genome Browser image of SRF ChIP-seq data at the promoters of Srf, Vcl, c-fos and Egr1, as indicated. (B) UCSC Genome Browser image of MKL1 ChIP-seq data at the promoters of Srf, Vcl and Cyr61, as indicated. (C) UCSC Genome Browser image of ELK4 ChIP-seq data at the promoters of Srf, c-fos and Egr1, as indicated.

