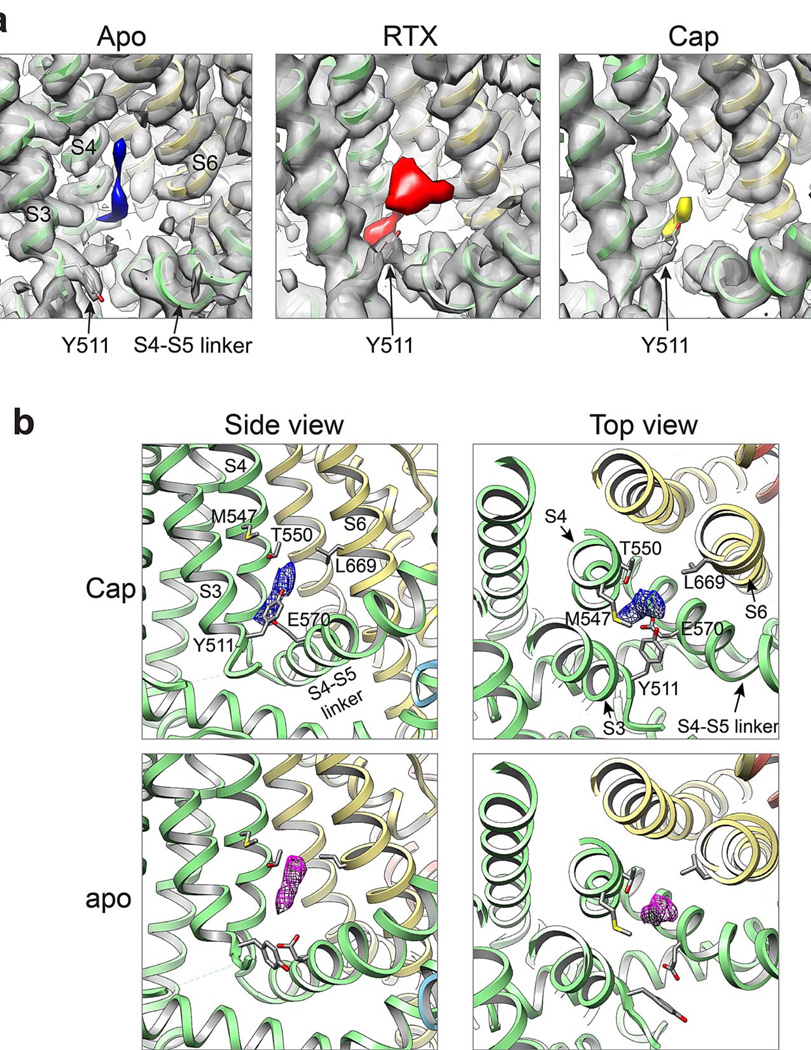
Extended Data Figure 7. Observed densities in vanilloid pocket.
a, Non-protein associated densities in the region adjacent to S3-S4 transmembrane helices observed in 3D density maps of apo TRPV1 structure (blue, 3.4Å, −100Å2) or TRPV1 in complex with RTX/DkTx (red, 3.8Å, −150Å2) or capsaicin (yellow, 3.9Å, −150Å2), as indicated. b, Density of bound capsaicin (blue) viewed from the side (left) and top down (i.e. from the extracellular face; right). Density is also observed in the apo-channel structure (purple), possibly representing an endogenous lipid or other small hydrophobic molecule. All maps were low-pass filtered to 4.5Å with a temperature factor of −200Å2, normalized and displayed at the same sigma level (8Å).

