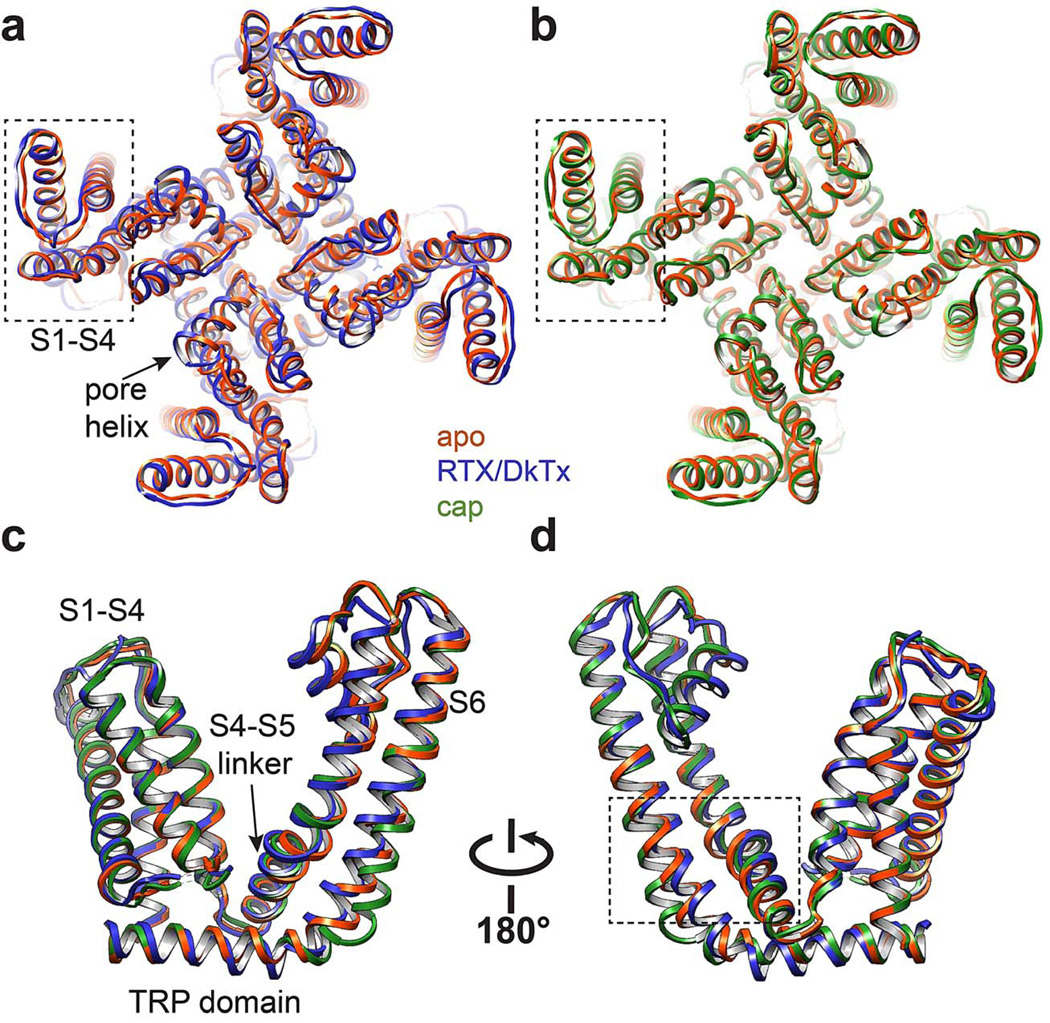
Extended Data Figure 9. S1-S4 as a stationary domain.
a, Superimposition of apo- and RTX/DkTx bound TRPV1 structures (orange and blue, respectively) from top-down view. S1-S4 domain (outlined in dashed box) shows near complete overlap. b, Same comparison for apo- and capsaicin bound channel structures (orange and green, respectively). c, d, Superimposition of transmembrane core of apo- versus RTX/DkTx- or capsaicin-bound TRPV1 structures (orange, blue, and green, respectively). Dashed box denotes region highlighted in Figure 6.

