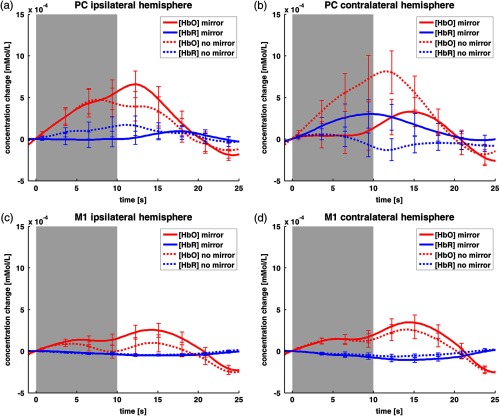
Fig. 4.
Time courses averaged over all subjects () of the PC- (a, b) and M1-ROIs (c, d), contra- (a, c) and ipsilateral (b, d) to the moving hand. The duration of stimulus presentation is shaded in gray. HbO is presented in red, while HbR is coded in blue. Time courses have error bars with standard error of the mean.

