
Fig. 5.
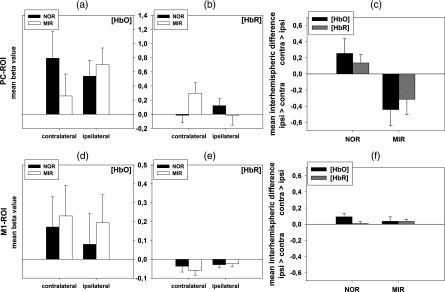
Mean beta values and differences, and their corresponding standard errors at the PC-ROI (top row, a–c) and M1-ROI (bottom row, d–f). Left column (): mean beta values for HbO of the ipsi- and contralateral hemisphere for the MIR and NOR conditions; middle column (): mean beta values for HbR of the ipsi- and contralateral hemisphere for the MIR and NOR condition; right column (): mean interhemispheric differences in the MIR and NOR conditions for HbO and HbR (multiplied by ). Note that, in the figures of the right column, values indicate activation in the contralateral ipsilateral hemisphere, and values indicate activation ipsilateral contralateral.