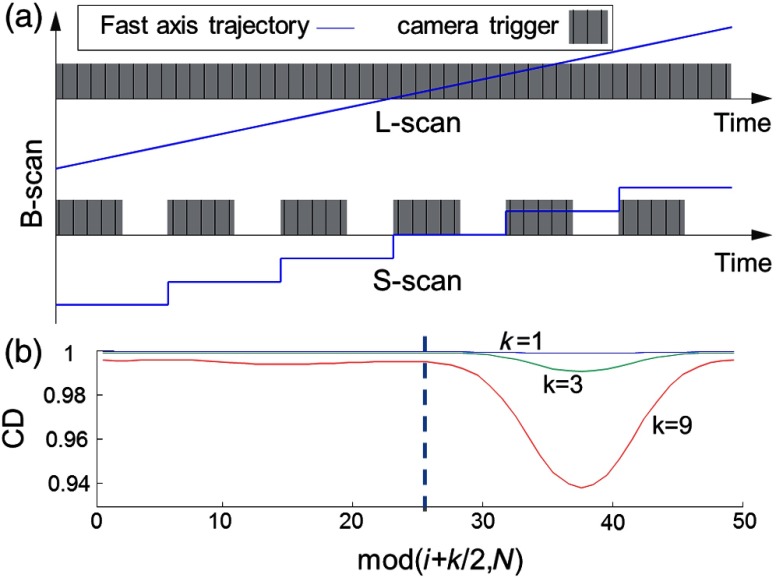
Fig. 1.
Comparison between S- and L-scans in terms of degree of correlation between skipped A-scans. (a) Schematic of L- and S-scan patterns and camera triggers within one B-scan. (b) Absolute values of the degree of correlation averaged according to the remainder of () divided by for S-scan when the system images a stationary cardboard.

