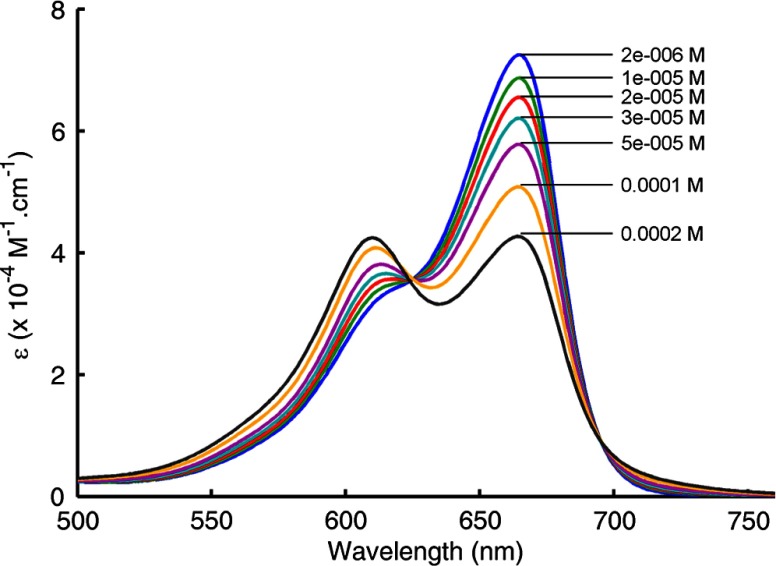
Fig. 2.
Absorption spectra of MB in water (2 to 200 μM). The absorption maximum shifts from 665 to 608 nm with increasing [MB] indicating an increase in the dimer-to-monomer molar ratio. The isosbestic point at 625 nm is shifted towards the blue wavelengths for [MB] due to the formation of higher order aggregates.

