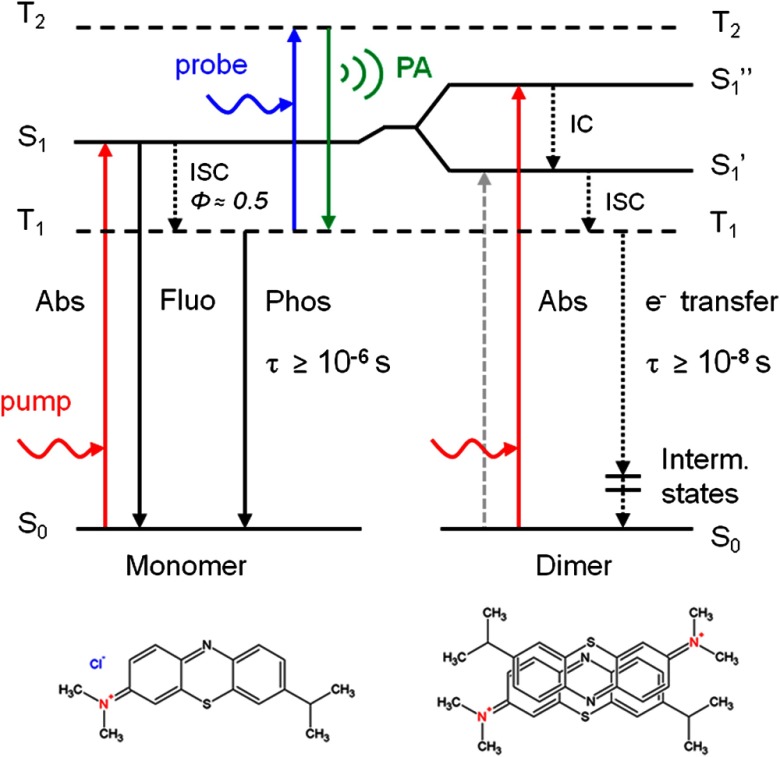
Fig. 3.
Energy diagram of MB monomer and dimer. Plain lines represent radiative transitions. Small downward dashed lines represent nonradiative processes. The energy of the absorption is converted into a photoacoustic relaxation signal. The double bar indicates a discontinuity in the transition diagram: the dimer triplet undergoes electron transfer () which leads to the formation of oppositely charged radicals that relax to the ground state via charge recombination ( to ). : ground state, : singlet excited state, : primary triplet excited state, : secondary triplet excited state, and : split exciton states, ISC: intersystem crossing, IC: internal conversion. Bottom: possible configurations of MB monomer and H-type dimer.

