
Fig. 6.
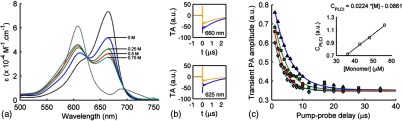
(a) Solid lines: absorption spectrum of a solution of MB 80 μM for four different salt concentrations. Dashed lines: individual MB monomer (black) and dimer (gray) spectra in water. (b) Transient absorption (TA) of a solution of MB 80 μM with (orange/gray) and without 0.8 M (blue/black) measured by flash photolysis. Top: . Bottom: . (c) Transient photoacoustic signal amplitude as a function of pump-probe delay time acquired at four different concentrations, 0 M (Δ), 0.25 M (□), 0.5 M (○), and 0.75 M (◊). Inset: the photoacoustic contrast parameter was observed to be linearly dependent on the estimated monomer concentration ().