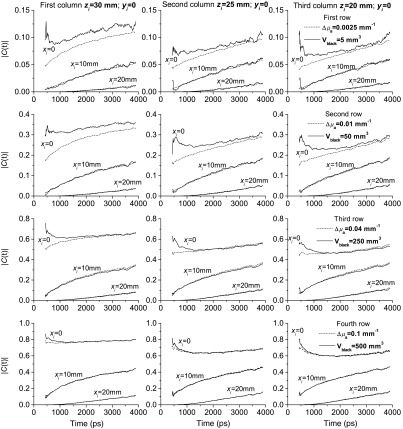
Fig. 4.
Monte Carlo comparisons between the time-resolved transmittance contrast due to a realistic absorption change within a volume of (dotted curves) and that of an equivalent black sphere (solid curves). A slab 40 mm thick with and refractive index equal to 1.33 is considered. Four realistic inhomogeneities with different values of (rows) are set at decreasing depths , 25, 20 (columns) and compared to the equivalent black inclusions. The plots display the relative contrast for three different arrangements of the inclusion, namely transmittance measurements on-axis () and off-axis, with an -offset of 10 mm and of 20 mm, with the source placed at (0,0,0) and the detector placed at (0,0,40) mm. The results are independent of .

