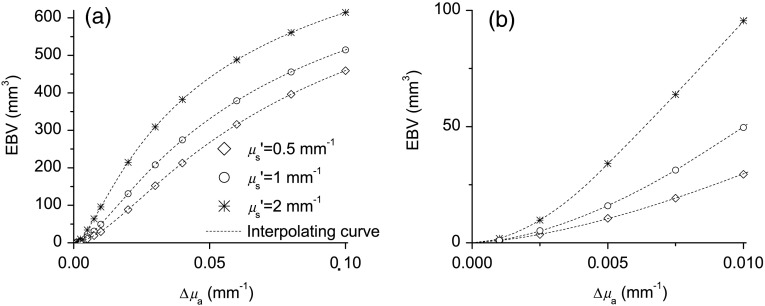
Fig. 7.
The figure summarizes the measure in EBV units for spherical realistic inhomogeneities with a volume of as a function of their absorption (). Three different choices of the background are displayed, namely (diamonds), 1 (circles), and (stars). The markers are MC results, while the continuous dotted curves represent the interpolation of the MC simulated points using empirical interpolating functions. In (a) there is the full dataset, while in (b) there is the first part of the same data on an enlarged scale.

