
Fig. 5.
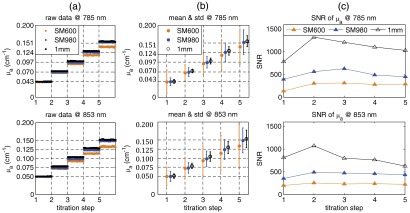
(a) Measured values at the two wavelengths (785 and 853 nm) collected by the single-mode (SM600), few-mode (SM980), and multimode (1 mm) fibers during the phantom titration experiment. The horizontal dashed lines indicate theoretical values of the phantom at each step; (b) averaged values and standard deviations of noise (error bars) at the two wavelengths. The standard deviations of noise are multiplied by a factor of 100 to clearly display the error bars; and (c) corresponding SNRs of values at the two wavelengths and five titration steps.