
Fig. 3.
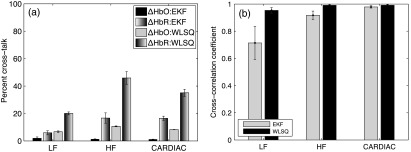
Simulated NIRS data residual analysis: (a) percent cross-talk error in and solution obtained using EKF ad WLSQ. Error bars show standard error; (b) mean sum squared cross-correlation coefficients for LF, HF, and CARDIAC filtered residuals for EKF and WLSQ.