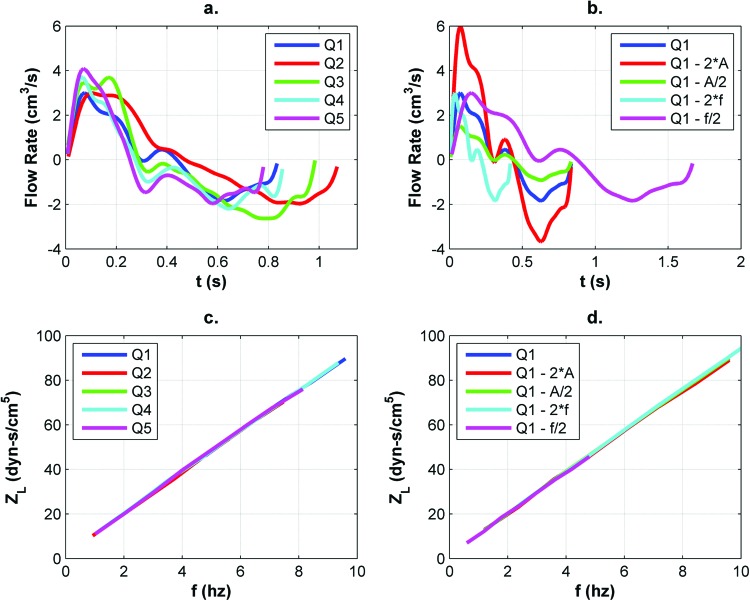
Fig. 3.
(a) CSF flow waveforms (Q#) from five different subjects and (b) example waveform with modified properties used to demonstrate that LI values (c and d), integrated from the sum of ZL values on the y-axis, were independent of flow waveform shape over the range of frequencies analyzed (A and f represent waveform amplitude and frequency, respectively)

