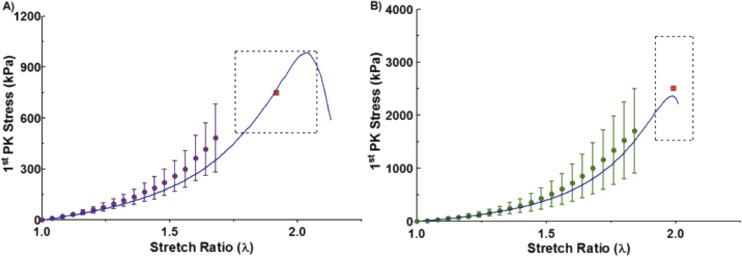
Fig. 5.
First Piola–Kirchhoff stress as a function of stretch ratio for the experiment (dots with 95% confidence interval) and model (solid blue line). Colored dots represent the mean experimental stress and error bars depict the 95% confidence interval. The red square indicates the mean peak tensile strength and stretch, and the surrounding dotted black box indicates the 95% confidence interval for the peak experimental stress and stretch with (a) being experimental and model results in the AXI orientation and (b) being experimental and model results in the CIRC orientation.

