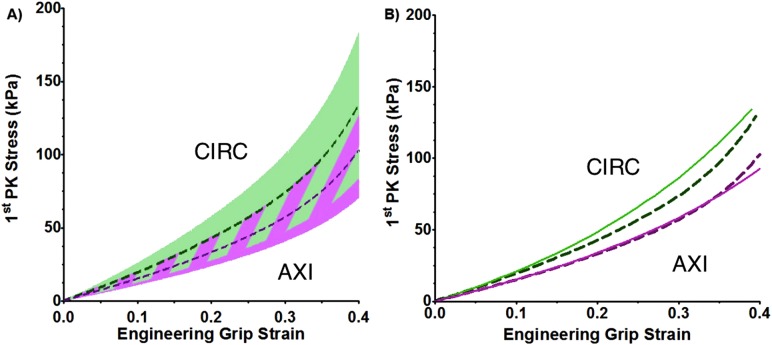
Fig. 7.
(a) Mean first Piola–Kirchhoff stress as a function of grip strain for the biaxial experiment (dashed purple line for AXI and dashed green line for CIRC, n = 9) with 95% confidence interval (purple and green shaded areas, respectively). The striped shaded area represents overlap of the 95% confidence interval of the two orientations (p < 0.05). (b) Mean biaxial model first Piola–Kirchhoff stress as a function of grip strain (solid purple line for AXI and solid green line for CIRC, n = 10) compared to mean experimental results (dashed purple and green lines, respectively, n = 9).

