
Figure 2.
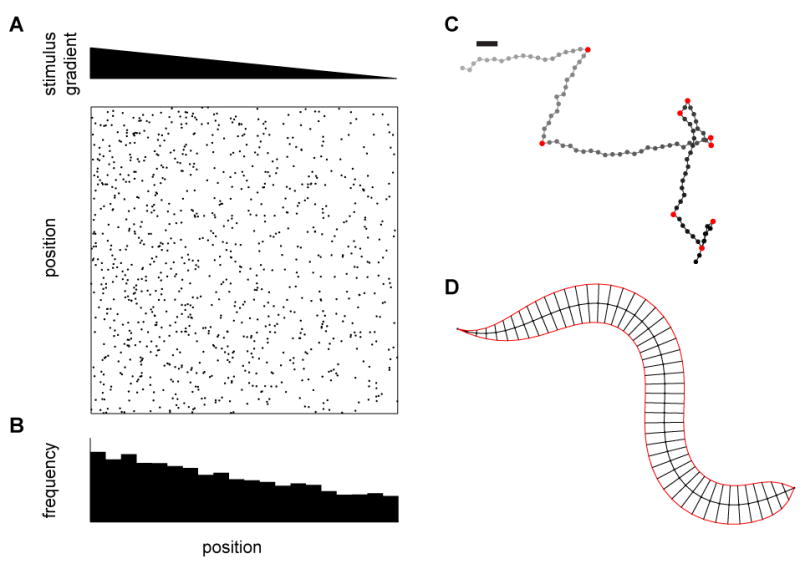
Different levels of behavioral metrics. (A) Tactic behaviors cause animals to migrate up or down gradients of some environmental cue. Here we examine the case of tracking C. elegans to measure a tactic behavior. The top triangle represents a gradient in stimulus magnitude, and each dot in the field below represents an instantaneous center of mass position of a worm in the gradient. On this scale, dot diameters are roughly the size of the worm. (B) In steady state, the distribution of worm positions over the gradient can be measured as an index or as a full distribution. Such measurements can also be made over time, incorporating transient changes in distribution. (C) At a finer scale, each worm’s track can be reconstructed in order to extract out the statistics of the worm’s coarse movements, including speed, heading, and, for instance, turning events. Turns are marked in red, gray dots represent early locations, black later locations, and the bar represents a worm’s body length. The integration over time of relevant statistics at this level should result in the distribution measured in (B). (D) More finely still, the shape of the worm’s bending over time can be analyzed to extract patterns in muscle activation. These patterns must ultimately result in the statistics in (C) and the distribution in (B).