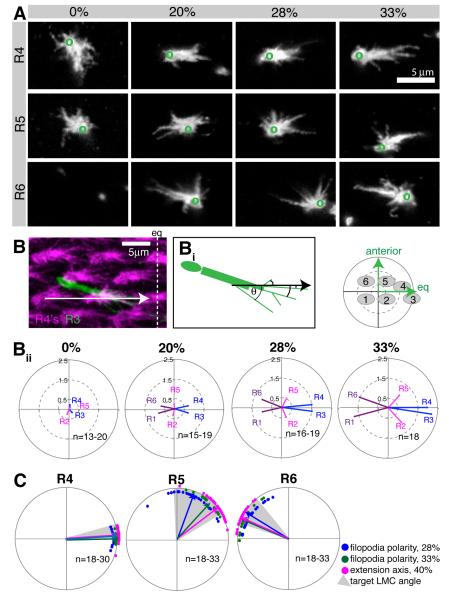
Figure 2. R cell growth cone polarity increases over time.
(A) Single R4, R5 and R6 growth cones labeled with GFP-myr, at 0, 20, 28 and 33% apf; ventral hemisphere, equator to the right, anterior up. Green circles indicate location of the axon shaft. Images for R1-R3 are in Figure S2. R6 growth cones have not expanded yet at 0% apf, and only the axons shaft is visible. (B) R4 growth cones were labeled by mδ-Gal4 UAS-mtdTomato (magenta), and a single R3 with GFPmyr (green); maximum intensity projection of 5μm thick stack, 33% apf; eq: equator. (Bi) Filopodia were measured from the growth cone base to their tip; the angle θ is the angle of the filopodium with respect to the alignment of R4 growth cones (black arrow). (Bii) Polar plots of the mean R cell polarity vectors between 0 and 33% apf. The small plot denotes the spatial orientation and location of the R cell targets. (C) Growth cone polarity at 28% apf (blue) and 33% apf (green) correlates with the angle of extension at 40% apf (magenta). Shown are mean polarity angles; arrows indicate mean polarity vector for the population; each dot represents a single R cell. Grey areas show the angles of the target LMCs. Plots for R1-R3 are in Figure S2.

