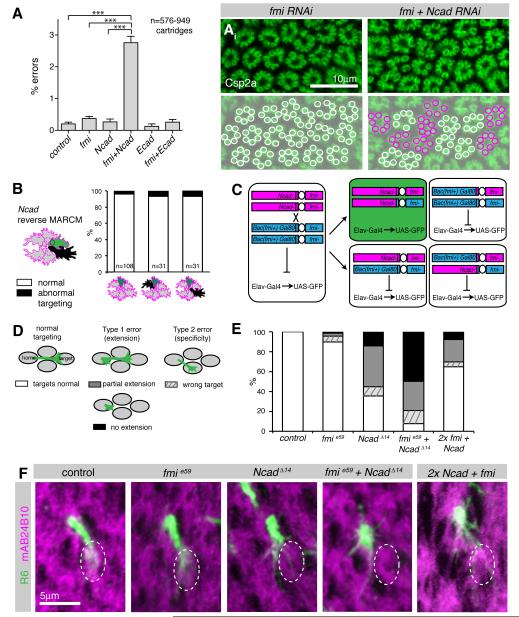
Figure 3. Fmi and Ncad genetically interact to mediate R cell growth cone extension.
(A) Single and double RNAi against fmi, Ncad, Ecad and LAR under control of gmr-Flp: actin>y>Gal4. Shown are % of errors by single R cells. Mean values + SEM. ***p<0.001, one-way ANOVA with Newman-Keuls post hoc test. (Ai) Lamina and its reconstruction in fmi single and Ncad fmi double RNAi expressing flies, labeling Csp2a; cartridges with six terminals in white and with five or seven terminals in magenta. (B) Targeting defects of single Ncad homozygous wild-type R cell growth cones (green) with or without Ncad mutant neighbors (black) in a heterozygous background (grey), at 38% apf; left bar: all neighbors are wild-type, center bar: one direct neighbor is mutant, right bar: one indirect neighbor is mutant. None of the groups are significantly different from each other (Fisher’s exact test). R1-6 cells were pooled. (C) Schemata of MARCM strategy to generate single cells double mutant for Ncad and fmi. Flies were mutant for fmie59/fmi192 and rescued with a Bac construct (Bac(fmi+)), see Figure S3), which sits in cis to Gal80 and in trans to Ncadδ14. After mitotic recombination, only the double mutant daughter cell will have lost the Gal80 containing chromosome arm, resulting in de-repression of GFP (green). The wild-type sister clone (top right) contains two wild-type copies of both Ncad and fmi, while two other outcomes of recombination result in cells heterozygous wild-type for both genes. (D) Schemata illustrating types of targeting defects. (E) Quantification of targeting phenotypes of fmi and Ncad single and double mutant cells, as well as cells homozygous wild-type for both fmi and Ncad (2x) using reverse MARCM (see text for description) at 38% apf. R1-R6 cells were pooled. All groups were significantly different from control with p<0.001, or p<0.05 for control vs. fmi; Fisher’s exact test, adjusted for multiple comparisons; n=71-123. (F) Single R6 growth cones at 38% apf labeled with CD8GFP (green), counterstained with mAb24B10 (magenta) to visualize cartridges. The wild-type R6 target cartridge is marked with a dotted white line; projected stacks of 3-5.5 μm; dorsal lamina hemisphere, equator down. Growth cones mutant for Ncad, for Ncad and fmi, as well as growth cones with elevated cadherin levels (2x) showed reduced or no target interactions.

