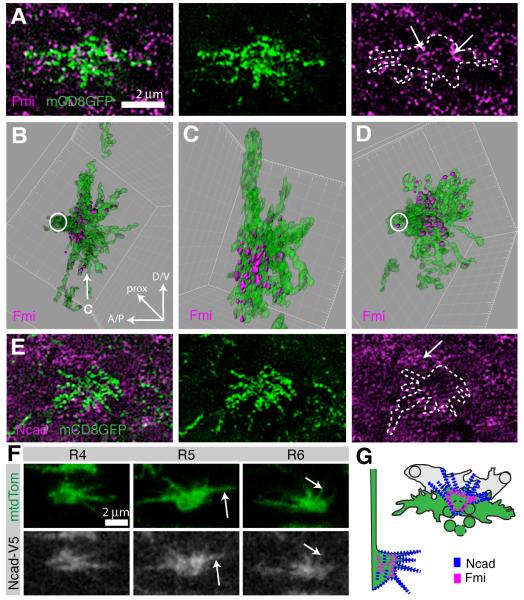
Figure 6. Fmi protein in enriched in the central domain of the growth cone, while Ncad protein is more broadly localized.
(A-E) R2 and R5 growth cones were sparsely labeled using R49A06-Gal4, mδ-Gal80 driving UAS-mCD8GFP (green) expression at 28% apf, co-stained with Fmi (magenta, A-D) or Ncad (magenta, E) and imaged using SIM. (A,E) Single optical sections of 125nm. (B,C) 3D reconstruction of the growth cone shown in (A) and Fmi contained within it (see Experimental Procedures). Fmi forms prominent patches at the base of the growth cone and is largely excluded from filopodia. (D) Second example of reconstructed growth cone. (B,D) en face view and (C) lateral view as indicated by arrow in (B). (E) Similar to Fmi, Ncad forms small patches at the membrane, but Ncad levels are low in the growth cone as compared to surrounding LMCs (arrow). (F) Single confocal sections at 28% apf, labeled with mtdTomato (green) and Ncad-V5 (white). Ncad localizes broadly within the growth cone, including filopodia (arrows). Growth cones from ventral hemisphere, equator to right. (G) Schemata of Ncad (blue) and Fmi (magenta) localization, en face view at left top and lateral view at right bottom. See also Figure S6.

