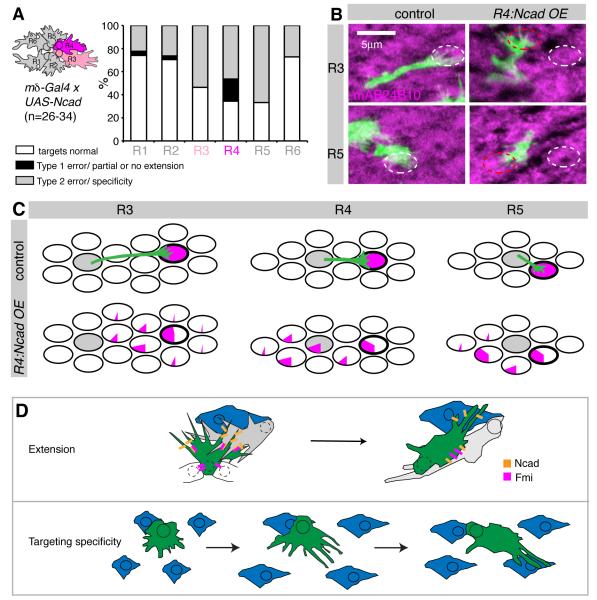
Figure 7. Ncad is sufficient to mediate R cell interactions.
(A-C) Ncad overexpression (OE) in R4 and weaker and early in R3 (see cartoon) using mδ-Gal4, analyzed at 40% apf. (A) Quantification of targeting defects across different R cell subtypes. (B) Examples of R3 and R5 growth cones in both wild-type and R4:Ncad OE (green), counterstained with mAb24B10 to visualize cartridges. Correct targets are shown in white ovals, incorrect targets in red ovals; z-stacks of 4.5-6μm, dorsal hemisphere, equator to right. (C) Graphical summary of R cell targeting. Each oval represents one cartridge. Pie charts display the percentage of R3-R5 cells that targeted each cartridge. The home cartridge is in grey; the correct target cartridge outlined in bold. (E) Models of how cadherin-mediated adhesion controls axon extension and targeting specificity. LMC processes: blue, Ncad: orange, Fmi: magenta.

