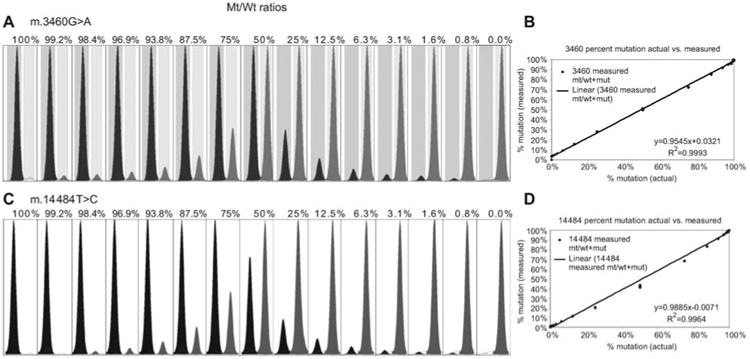
Figure 4.

SNaPshot quantification of mtDNA heteroplasmy.
(A) Relative peak sizes obtained using known mixtures of cloned 3460 mutant and normal allele mtDNA fragments. Actual percent heteroplasmy is listed above each peak mixture. Heteroplasmic quantity was determined using the area under the curve for each peak divided by the sum of the WT and mutant peak areas. (B) XY scatter plot of data shows the linear regression of measured vs. actual heteroplasmy from panel (A), m.3460G>A, determined by the goodness of fit for our method. (C, D) Heteroplasmic quantification of the m.14484T>C LHON mutation.
