
FIG 2.
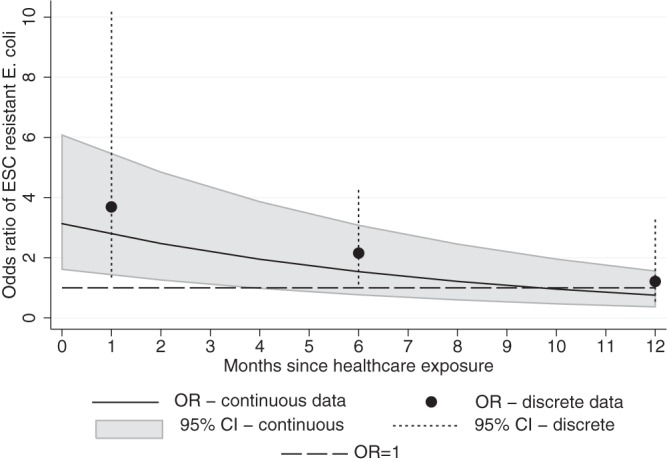
The risk of ESC-R E. coli infection over a 12-month period after the most-recent episode of health care exposure, excluding day procedures, estimated with two data sets. The smoothed curve was calculated using continuous data corresponding to the months since hospital admission (black line; 95% CI in gray). Discrete intervals determined using Friedman criteria are indicated (black dots; 95% CI as vertical dashes). The dashed line represents no increased risk (odds ratio = 1.0).