FIG 2.

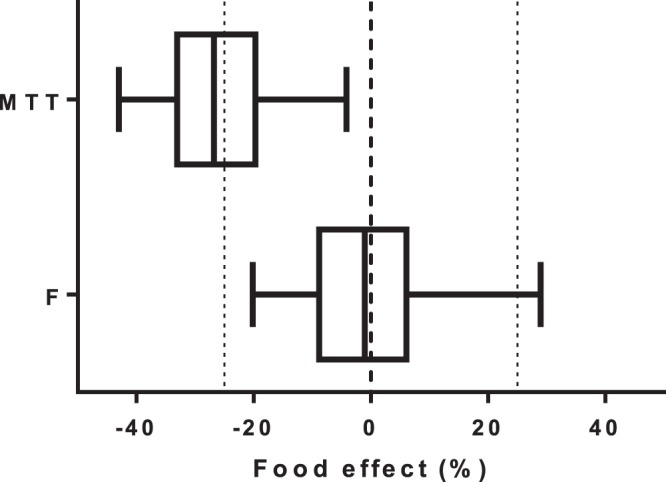
Box plots (interquartile ranges with 2.5 to 97.5 percentiles) showing the effect of estimated food effects on mean absorption transit time (MTT) and relative bioavailability (F). Vertical dashed lines indicate no effect and ±25% effects.

Box plots (interquartile ranges with 2.5 to 97.5 percentiles) showing the effect of estimated food effects on mean absorption transit time (MTT) and relative bioavailability (F). Vertical dashed lines indicate no effect and ±25% effects.