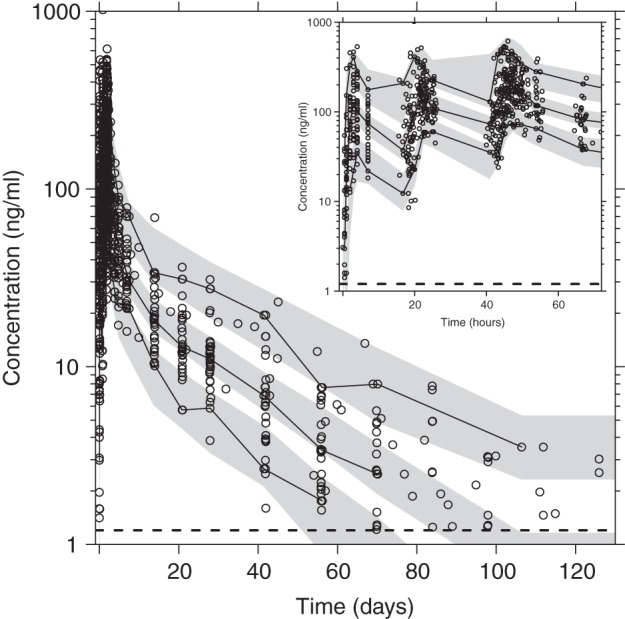
FIG 4.

Visual predictive check of the final model describing the population pharmacokinetics of piperaquine in fasting (n = 15) and fed (n = 15) patients with uncomplicated P. falciparum malaria. The inset shows piperaquine simulations at 0 to 72 h. Open circles, observed data points; solid lines, 5th, 50th, and 95th percentiles of the observed data; shaded areas, 95% confidence intervals of simulated (n = 2,000) 5th, 50th, and 95th percentiles. Broken horizontal lines are the lower limit of quantification. Venous plasma piperaquine concentrations were transformed into their logarithms (base 10).
