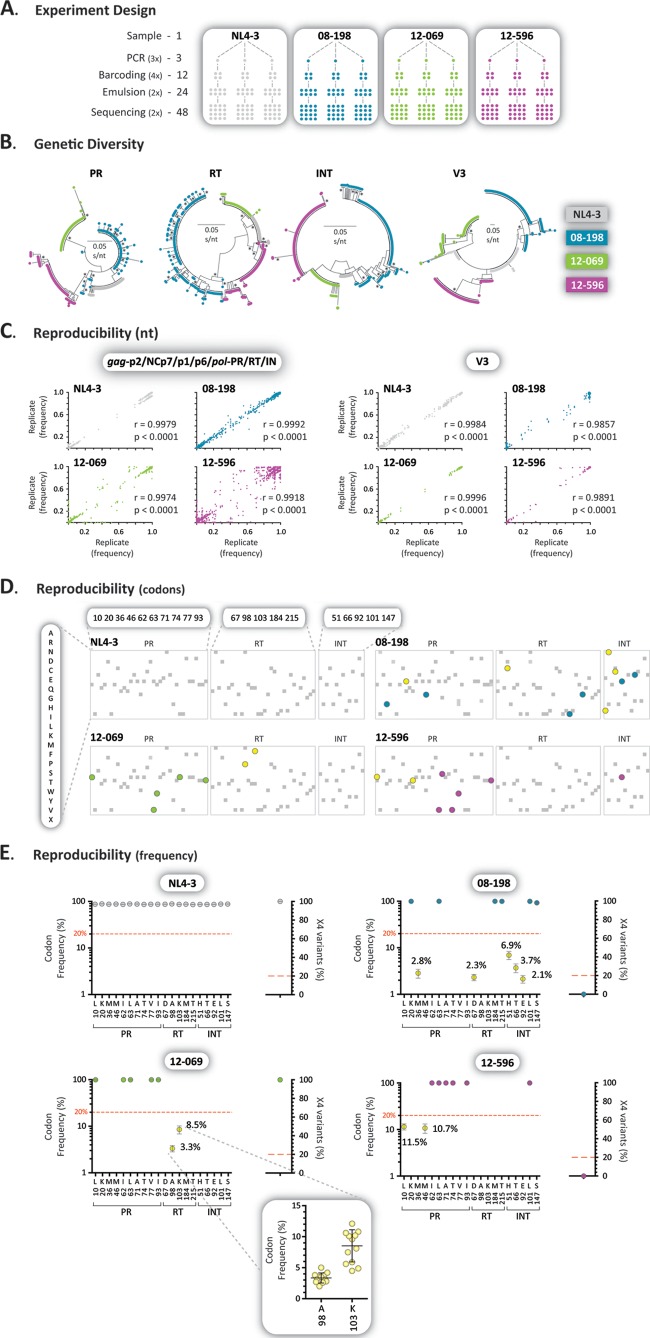
FIG 4.
Assay reproducibility. (A) Samples from two antiretroviral-naive (NL4-3 and 12-596) and two antiretroviral-experienced (08-198 and 12-069) individuals were reverse transcription-PCR amplified in triplicate, each amplicon was bar coded four times, and two DNA libraries were prepared and sequenced in duplicate for a total of 48 sequences per sample. (B) Neighbor-joining phylogenetic trees constructed using reads with a frequency of >1 corresponding to 105-bp fragments from the protease, RT, integrase, and V3 regions. Each color-coded dot represents a unique variant; frequency is not depicted. Bootstrap resampling (1,000 data sets) of the multiple alignments tested the statistical robustness of the trees, with percentage values of >75% indicated by an asterisk. s/nt, substitutions per nucleotide. (C) Pearson's correlation coefficient was used to determine the strength of association between the frequency of each nucleotide at each position among the 16 sequences obtained for each one of triplicate amplicons (n = 48) for all four viruses in the gag-p2/NCp7/p1/p6/pol-PR/RT/IN and env-V3 regions. Over 135,000 and 5,000 points are included in each one of the gag-p2/NCp7/p1/p6/pol-PR/RT/IN and env-V3 plots, respectively. r, correlation coefficient; p, two-tailed P value. (D) Amino acids detected in codons associated with drug resistance in the protease, RT, and integrase regions according to the IAS-USA (77). Drug resistance mutations with a frequency of ≥20% (blue, green, or purple), <20% (yellow), or any other amino acid changes (gray) are indicated. Only amino acid substitutions with a frequency >1% are depicted. (E) Frequency of amino acids in positions associated with drug resistance (gag-p2/NCp7/p1/p6/pol-PR/RT/IN) or X4 variants (env-V3) found in any of the four samples. Each dot represents the mean and 95% confidence interval, with the exception of the inset (sample 12-069), in which each dot indicates the frequency of amino acids detected in each of the 48 replicates, including their mean ± standard deviation.

