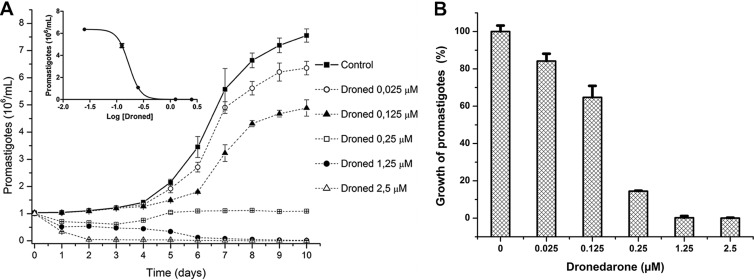
FIG 2.
Inhibition of L. mexicana promastigotes growth by dronedarone. (A) Susceptibility of promastigotes to dronedarone (Droned). Each point represents the mean ± SD of at least three independent experiments. (Inset) Dose-response curve from panel A (IC50, 115 nM). (B) Percentages of growth inhibition induced by dronedarone in promastigotes. All of the values were taken from the data of panel A, using the values obtained at 10 days after addition of the corresponding drug concentration. Each point represents the mean ± SD.

