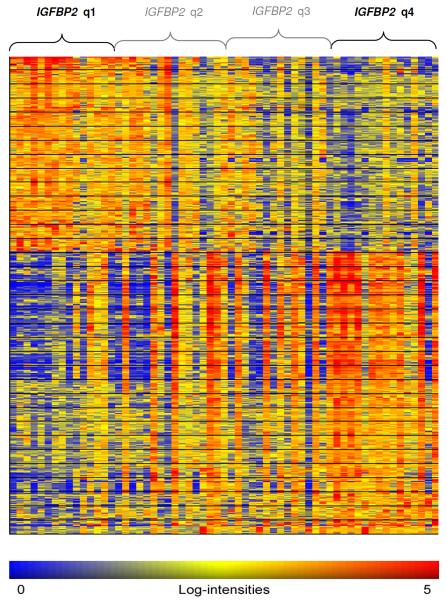
Figure 2. Heat map of differentially expressed probe sets between high and lowIGFBP2 expression groups.
Columns represent samples ordered by IGFBP2 expression and rows represent genes ordered by hierarchical cluster analysis. Colors indicate relative expression of each gene with respect to the median expression level (red above, yellow equal, blue below the median value).

