
FIG 4.
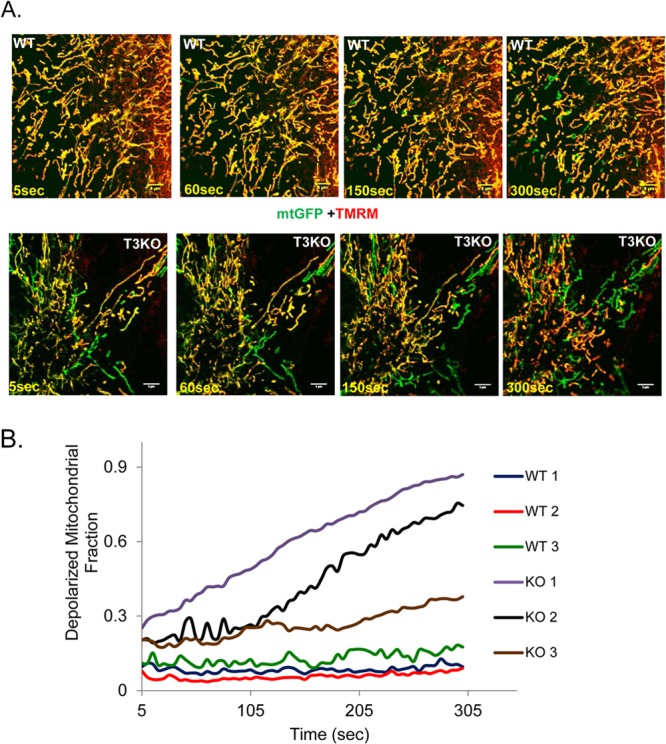
SIRT3KO cardiac fibroblasts exhibit loss of mitochondrial membrane potential (ΔΨm). (A) Still images over a time period of 5 min of WT and SIRT3KO cardiac fibroblasts expressing mtGFP (green) and colabeled with TMRM (red, appearing yellow when merged with green). In live videography, lack and delay in the appearance of yellow mitochondria indicate a defect in ΔΨm. (B) Quantitation of depolarized mitochondria (ratio of TMRM-positive to total mitochondria) for the images shown in panel A. The data shown are representative of four separate experiments. Scale bar, 5 μm.