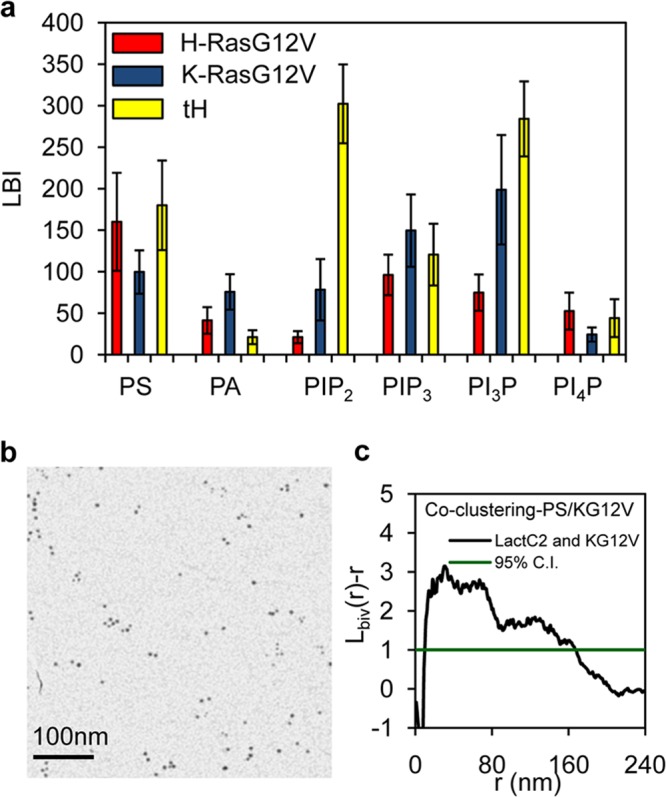
FIG 1.

Ras nanoclusters have distinct lipidic compositions. (a) PM sheets prepared from BHK cells coexpressing GFP-LactC2 (to detect PS), GFP-Spo20 (PA), GFP-PH-PLCδ (PIP2), GFP-PH-Akt (PIP3), GFP-PH-FYVE (PI3P), or FAPP1-GFP (PI4P) with RFP–H-RasG12V, RFP–K-RasG12V, or RFP-tH (membrane anchor of H-Ras) were labeled with 2-nm anti-RFP gold particles and 6-nm anti-GFP gold particles and imaged by EM, and the relative distributions of the two gold populations were analyzed using bivariate K functions. The results are summarized as LBI values. The greater the LBI value, the greater the extent of coclustering of the two probes. (b) Sample EM image of 6-nm anti-GFP gold particles and 2-nm anti-RFP gold particles on a PM sheet coexpressing GFP-LactC2 and RFP–K-RasG12V. (c) Bivariate K function analysis of coclustering between the 6-nm and 2-nm gold particles shown in panel b (a 1-μm by 1-μm PM sheet from the experiment whose results are shown in panel b was used). 95% C.I., 95% confidence interval for a random pattern. To obtain the LBI value, the area under the Lbiv(r) − r curve above the confidence interval is calculated as described in the text.
