FIG 2.

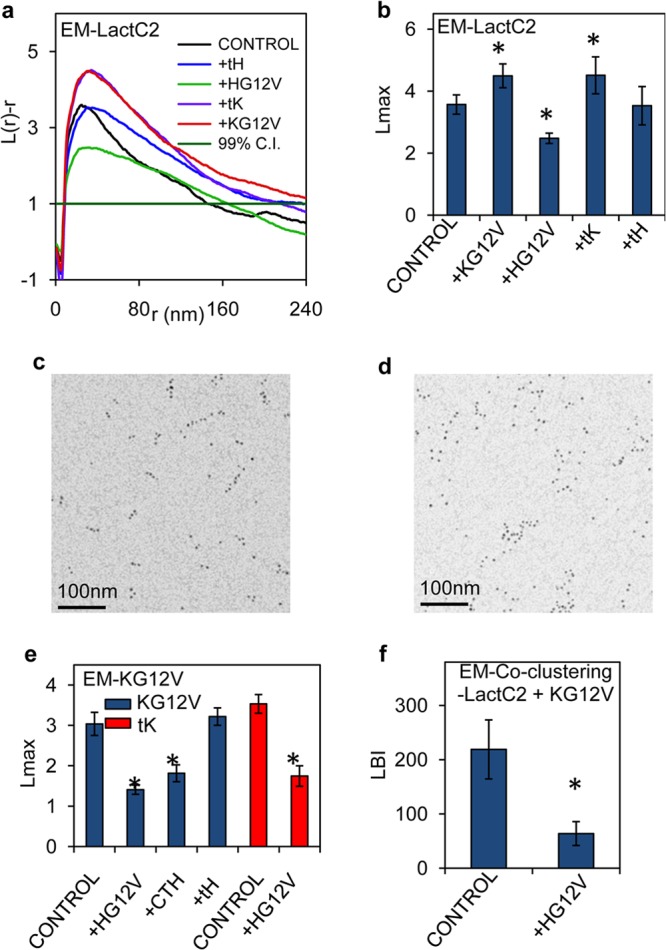
The presence of H-Ras–GTP disrupts nanoclustering of PS and K-Ras–GTP. (a) PM sheets prepared from BHK cells expressing GFP-LactC2 with or without RFP-tH, RFP–H-RasG12V, RFP-tK, or RFP–K-RasG12V were labeled with 4.5-nm anti-GFP gold particles. The spatial distribution of the gold particles visualized by EM was analyzed using univariate K functions. Plots of the weighted mean standardized univariate K functions are shown. (b) A useful summary statistic is the peak value, Lmax, of the univariate K function. Lmax values from the GFP-LactC2 analysis whose results are shown in panel a are means ± SEM. (c and d) Sample EM images of anti-GFP gold particles on a PM sheet from BHK cells expressing GFP-LactC2 alone (c) or GFP-LactC2 with RFP–K-RasG12V (d). (e) Univariate K function analysis as described for panel b, shown as mean Lmax values (±SEM), to evaluate the nanoclustering of GFP–K-RasG12V (KG12V) in BHK cells expressing GFP–K-RasG12V alone (control) or coexpressing RFP–H-RasG12V (+HG12V), RFP-CTH (±CTH), or RFP-tH (±tH). Similar experiments were performed to analyze the nanoclustering of GFP-tK (tK), expressed alone (control) or with RFP–H-RasG12V (±HG12V). Statistical significance of differences between the univariate K functions in panels b to e was evaluated in bootstrap tests (*, P < 0.05). (f) PM sheets prepared from BHK cells expressing GFP-LactC2 and RFP–K-RasG12V alone (control) or with HA-tagged H-RasG12V (+HG12V) were used to evaluate GFP-LactC2 and RFP–K-RasG12V coclustering as in a bivariate EM analysis. Statistical significance of differences between the bivariate K functions, shown as mean LBI values (±SEM), was examined using a Mann-Whitney test (* indicates a P of <0.05).
