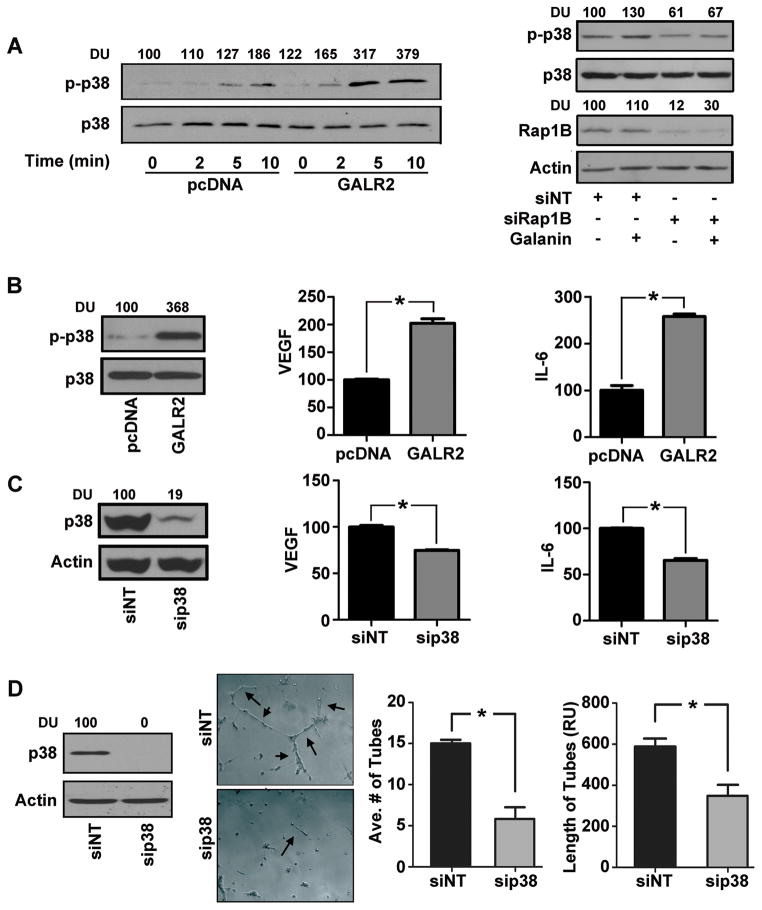
Figure 2. GALR2 stimulates cytokine secretion and angiogenesis via RAP1B-p38-MAPK.
(A) Stable mixed clonal population of UM-SCC-1-GALR2 or control pcDNA cells were serum starved for 4h and treated with 10nM Galanin for 0, 2, 5, or 10 minutes. Whole cell lysates were immunoblotted for phospho-p38 and p38 antibodies, quantified (DU) and expressed as percent of control (left panel). UM-SCC-1-GALR2 stable cells were treated with NT-siRNA or si-RAP1B. After 68h of transfection cells were serum starved for 4h and were either stimulated with 10nM galanin or vehicle control for 10 minutes. Both stimulated and unstimulated controls were immunoblotted with actin, RAP1B, p-p38 and p38 antibodies and were quantified (right panel). (B) UM-SCC-1-GALR2 or control cells were immunoblotted with p-p38 and total p38 antibodies (left panel). CM were collected and VEGF and IL-6 were quantified with ELISA as pg/ml/million cells and was finally expressed with normalization to control (right panels, *p<0.014). (C) UM-SCC-1-GALR2 cells were treated with si-p38 or NT-siRNA and were immunoblotted with p38 and actin antibodies (left panel). CM collected from cells were quantified for VEGF and IL-6 and expressed as normalized to control (right panel, *p<0.01). (D) UM-SCC-1-GALR2 cells were treated with si-p38 or NT-siRNA and immunoblotted (left panel). CM was collected, concentrated, normalized for equal cell count and HMEC-1 cells were seeded with corresponding CM and photographed (middle-left panel). Average number of tubes and tube length were quantified from 10 representative fields (right panel). Data is representative of three identical experiments each in triplicate (*p<0.008).

