
Figure 2. Reduced Mt number and DNA in DRG neurons of chronically STZ diabetic mice compared with non-diabetic controls.
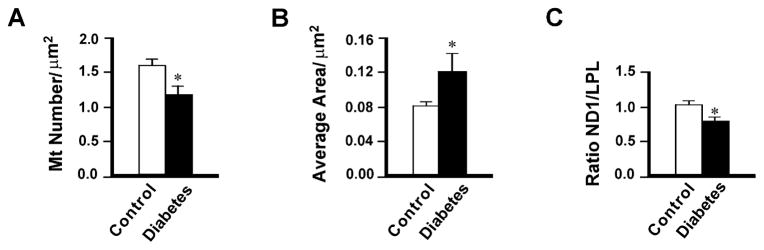
Mt density (A) and Mt size (B) were determined in mouse DRG using electron microscopy. Data are expressed as mean ± SEM. n=5. *P <0.05 between non-diabetic and diabetic mice. For measurement of Mt DNA content (C), total DNA was isolated from non-diabetic control and diabetic mice at 6 months and run for quantitative real-time PCR to obtain a relative ratio of ND1 (a gene coded on the Mt genome) over LPL (a gene coded on nuclear genome), an indicator for relative Mt DNA copy number. Data are normalized to controls and expressed as mean ± SEM. *P<0.05 by t-test between non-diabetic and diabetic mice. There is a decreased Mt density (A) and Mt DNA (C), and increased Mt size (B) in DRG neurons of diabetic mice compared with non-diabetic animals.