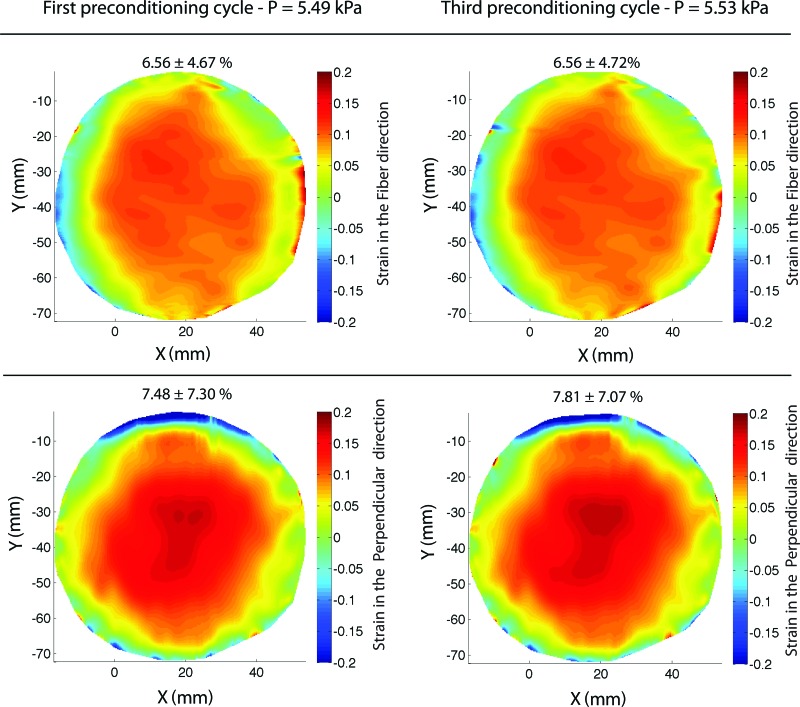
Fig. 6.
Contours of the strain in the fiber and perpendicular directions at the maximum pressure of the first and final cycle for the (M/61) human skin specimen tested at the slower 0.07 kPa/s loading rate with 15-min recovery periods. The mean and standard deviation of the strains across the entire contour are reported above each figure.

