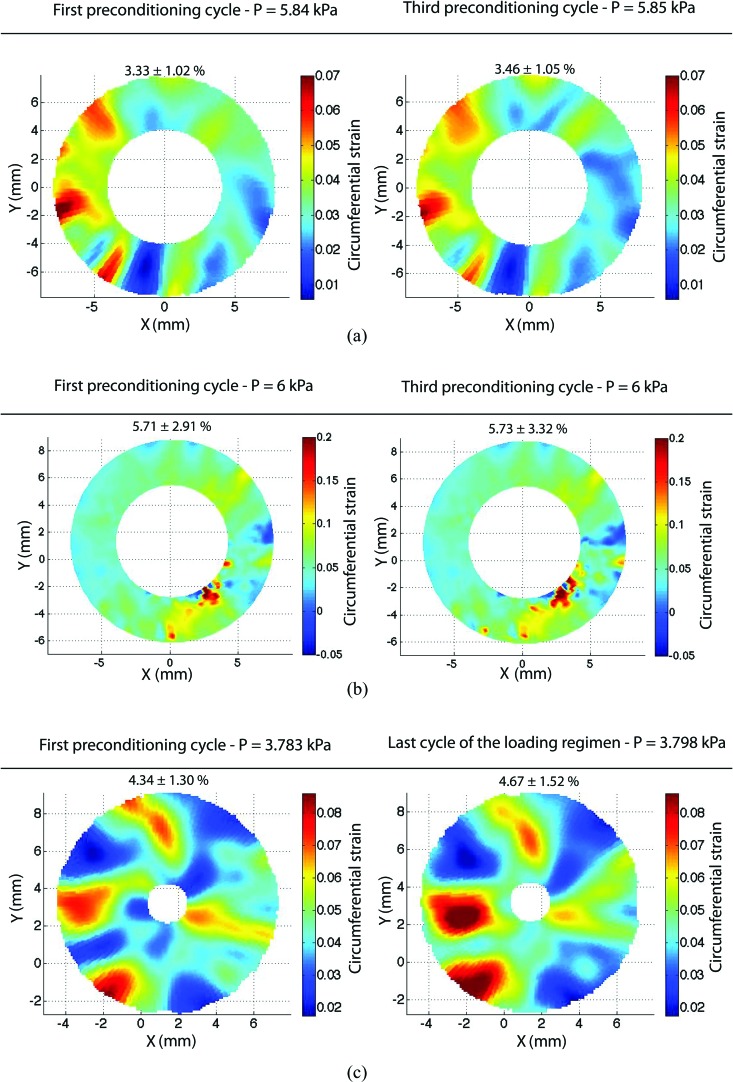
Fig. 9.
Contour plots of the circumferential strains at the maximum pressure of the first and final pressure cycles for (a) bovine cornea, (b) porcine sclera, and (c) bovine sclera. The bovine sclera plot in (c) included a final cycle after 4 hours of additional testing, including two creep tests and a slow load-unload test. The mean and standard deviation of the strains across the entire contour are reported above each figure.

