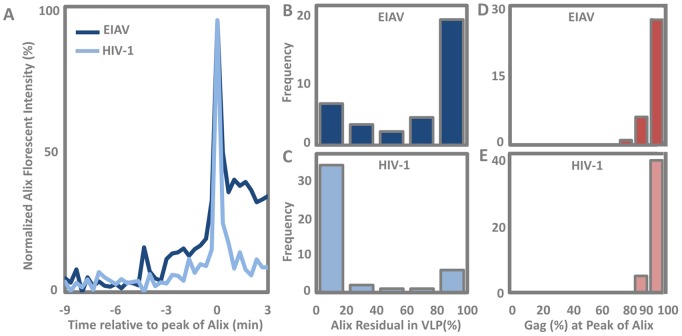
Figure 6. Characterization of ALIX recruitment.
A) Temporal averaging of ALIX fluorescence intensity, with all profiles lined up so the peak recruitment is positioned at time zero. This averaging shows early ALIX recruitment up to 5 minutes before appearing as a spike. The retained ALIX is also visible in HIV-1. B) Distribution of ALIX retention in EIAV VLPs. C) Distribution of ALIX retention in HIV-1 VLPs. (D and E) show percentile of total accumulated Gag within the VLP at the time of peak ALIX recruitment for EIAV and HIV respectively.

